Earth Lost 12.5 Trillion Tons of Ice in 47 Years
Satellites tracked 12.5 trillion tons of ice lost from Greenland and Antarctica since 1979, pushing sea levels up an inch and flooding millions more.
Satellites have tracked the disappearance of more than 12.5 trillion tons of ice from Greenland and Antarctica since 1979—enough frozen water to blanket the continental United States five feet deep, according to a major international study published Wednesday in the journal Scientific Data.
The melt has pushed global sea levels up about an inch, on top of other climate factors raising ocean heights, according to the report. An inch may not sound dramatic, but the human toll is: for every third of an inch of sea level rise, another 2 million to 3 million people get flooded at least once a year, said lead author Ines Otosaka, an ice scientist at Northumbria University in England.
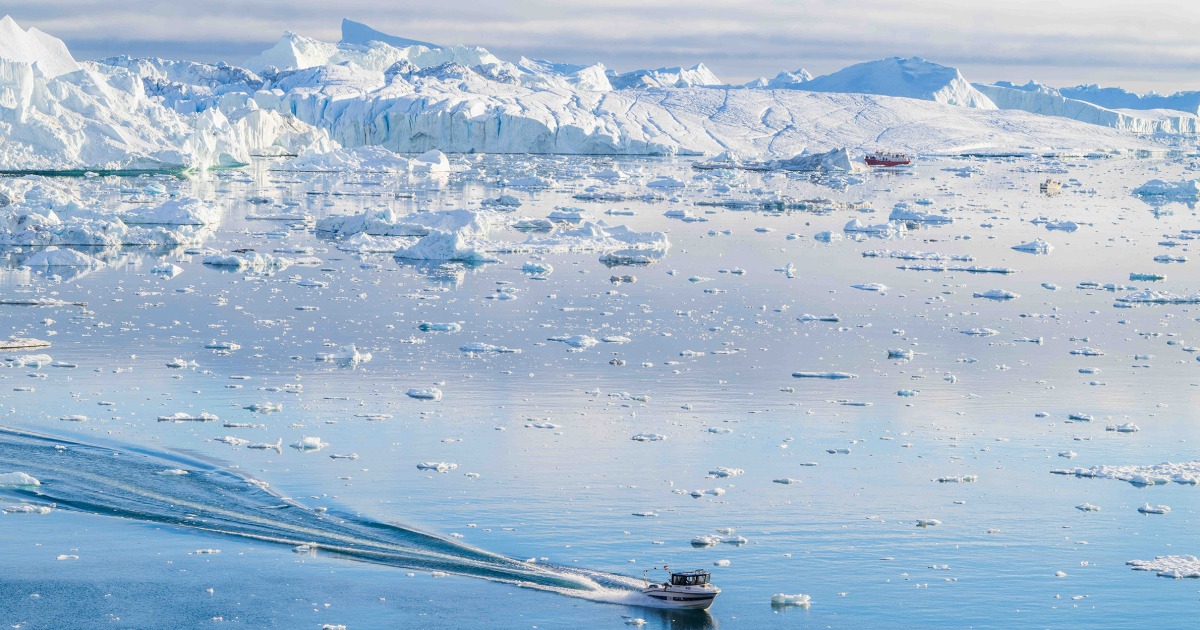 Photo: NBC News
Five-sixths of the melt is coming from below
A warming Earth is accelerating the melting of the planet’s two major ice sheets, but the mechanism driving most of the loss surprised many: five-sixths of the melt comes not from hotter air, but from warmer waters eating away at the ice sheets from below and the sides, with glaciers flowing into the oceans.
“The ice sheets are melting away fast,” said study co-author Eric Rignot, an ice scientist at University of California, Irvine. “We are melting the polar regions, sea level is rising worldwide and will exacerbate the vulnerability of coastal regions.”
The Jakobshavn glacier in Greenland is now retreating up to 164 feet a day, Otosaka said.
The numbers were stable—until they weren’t
The international collaboration of polar scientists, headed by the European Space Agency, had in the past only looked at ice sheet melt since the 1990s based on European satellite data. By incorporating NASA satellites, the scientists were able to chart ice sheet volumes in Antarctica back to 1979 and in Greenland back to 1972.
The new timeline revealed a stark pattern: in the 1970s, 1980s and into the 1990s, the ice sheets were relatively stable. Then melt started happening, and it really kicked in during the 2010s.
“There is a clear trend that the ice sheets are losing more mass and it has been increasing from decade to decade, especially if you look at the ice being discharged to the ocean,” Otosaka said. “And that’s quite clear that there’s a link to climate change.”
The accelerating numbers seemed to pause from 2020 to 2023, but the study’s authors said it reflected short-term weather variations, not long-term trends. A lot of the stability in Antarctica was because East Antarctica had record snowfall, which compensated for the rapid melting in the less stable West Antarctic Ice Sheet.
Otosaka said the study stopped with 2023 data, but she’s looked at measurements since and found the accelerating trend has picked back up. “Just a bump in the record,” Rignot said. “The long rise is climate, and the threat is crystal clear.”
 Photo: NBC News
‘Decades behind global warming’
The biggest changes scientists saw are in what they call dynamic processes—more abrupt and active than the slow, steady melting from the air—and that’s something prone to trigger runaway “tipping points,” Otosaka said.
“That’s something to be concerned about as it shows that the changes are tracking decades behind global warming, which means we can expect them to continue for decades more—even if we are able to stop heating the planet,” said study co-author Andrew Shepherd, also of Northumbria.
New York University ice scientist David Holland, who wasn’t part of the study, said that’s what concerns him “because most of the ice loss is dynamical and that is exactly what you would expect in an ice sheet instability collapse scenario.”
The international team used 45 independent surveys and 27 different satellites. “The use of relatively independent methods gives me greater confidence in the result,” said Holland. “The upward trend is real.”
University of Colorado ice scientist Ted Scambos, who wasn’t part of the study, said the findings point to a known but unresolved problem: “The ‘wild cards’ of Antarctic mass loss continue to pose a challenge for human management of the planet—a clear and present danger, but many decades in the future. We are now as a society smart enough to know the future, but not prudent enough to act upon the knowledge.”
How long-horizon markets might price this
The data matters beyond the science journals. Catastrophe bonds—securities that pay investors unless a specified disaster occurs—are designed to transfer risk from insurers to capital markets, and in principle could use sea-level thresholds as triggers. Reinsurers modeling hurricane and storm-surge payouts incorporate climate projections, though the link between a specific inch of rise and a single storm season remains probabilistic.
Prediction markets could, in principle, offer contracts on climate milestones—a named glacier retreating past a GPS coordinate, a sea-level threshold at a tide gauge—but the decades-long lag Shepherd described makes short-term contracts hard to price, and liquidity in climate prediction markets remains thin compared to political or economic events.
For anyone running probability calculations on long-horizon risks, the conditional chain probability calculator handles scenarios where each stage depends on the one before—useful when estimating compounding coastal exposure over multiple decades.
Primary source: NBC News
FAQ
How much ice has melted from Greenland and Antarctica since 1979?
More than 12.5 trillion tons, according to satellite data compiled by an international team of polar scientists. That volume would cover the continental United States five feet deep.
How does ice melt affect sea levels and flooding?
The 12.5 trillion tons of ice lost since 1979 has raised global sea levels by about one inch. For every third of an inch of sea-level rise, another 2 million to 3 million people experience flooding at least once a year.
What is causing most of the ice to melt?
Five-sixths of the loss comes from warmer ocean water eating away at ice sheets from below and the sides, not from warmer air above. This dynamic process is more abrupt than surface melting and more prone to runaway tipping points.